Where to find itCustomer panel › Metrics › Resource Usage ; Customer panel › Metrics › Visitors ; Customer panel › Metrics › Errors ; Customer panel › Metrics › Bandwidth ; Customer panel › Metrics › Web Statistics
Resource Usage
Open Resource Usage for a live picture of your account. CPU is shown as a percentage of one processor core, so 100% is one full core.
- The tiles at the top show CPU now (with the 24-hour average), Memory now (with the number of running processes), Bandwidth used this month against your limit, Disk used against your quota (with the share held by databases) and the number of Files.
- Limits lists your package's share of the server: CPU, memory, disk speed, processes, PHP requests at once and database connections. Under Last 24 hours it counts how long the CPU was held back and how often the memory, process and database limits were reached. Reaching a limit slows your account down or ends the request that needed more; it never affects other accounts.
- The charts (CPU, memory, bandwidth served, processes and others) can be switched between 1 hour, 24 hours, 7 days and 30 days and refresh every minute. Table under a chart shows its numbers.
- Monthly bandwidth lists the bytes served by all your websites for each month, against your limit.
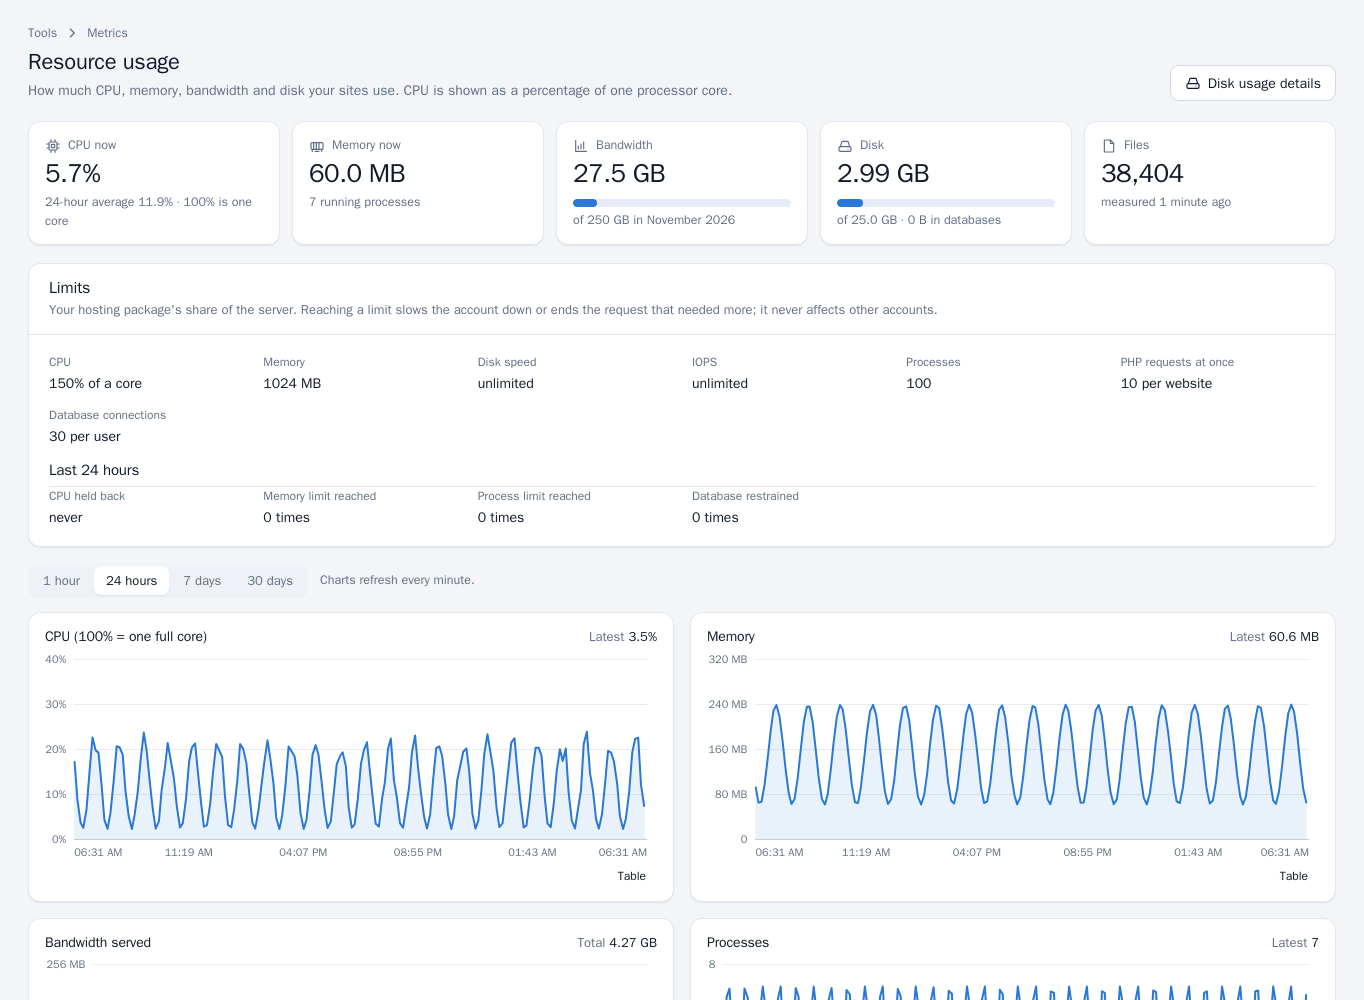
Disk usage details opens a breakdown of your folders and databases (see File Manager). The Bandwidth tool is the same page, scrolled to the bandwidth figures.
Visitors and Errors
- Open Visitors to see the most recent requests to a site, newest first: time, visitor address, request, status, size and referrer.
- Open Errors for the most recent web server errors, newest first.
- Use the domain selector at the top right to pick which site's log to read.
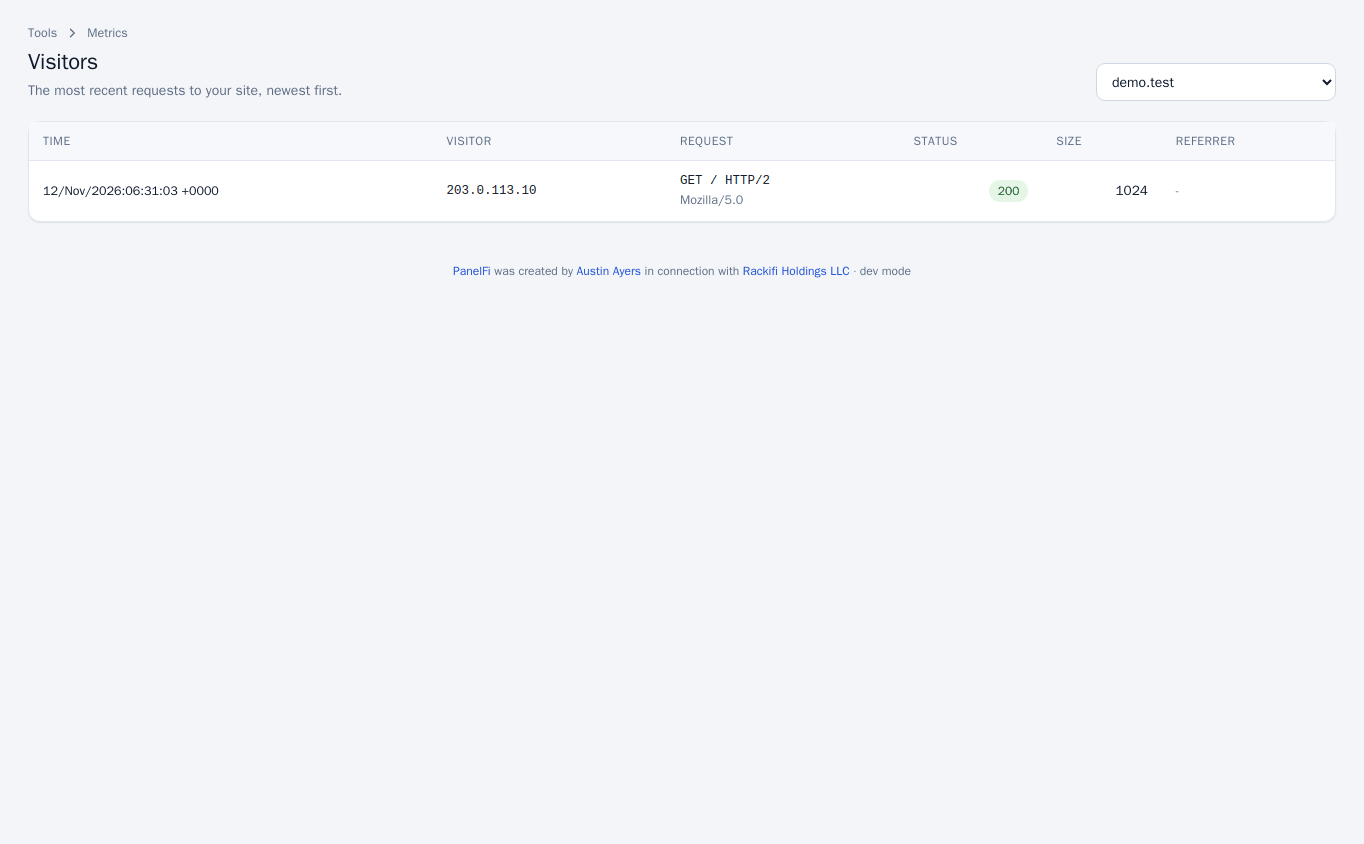
These pages show only the latest lines of the log (up to 300). For trends use Web Statistics.
Web Statistics
- Open Web Statistics, choose the Website and a Period (last 7, 30 or 90 days) and press Show.
- Read the totals: Visitors (different addresses), Page views (without images, styles and scripts), Requests (including crawlers and scripts) and Data sent, with the busiest hour in server time.
- Scroll for requests per day, Most viewed pages, Where visitors came from, Browsers, Devices, Pages that were not found (broken links worth fixing or redirecting), answers by result (2xx, 3xx, 4xx, 5xx) and a day-by-day table.
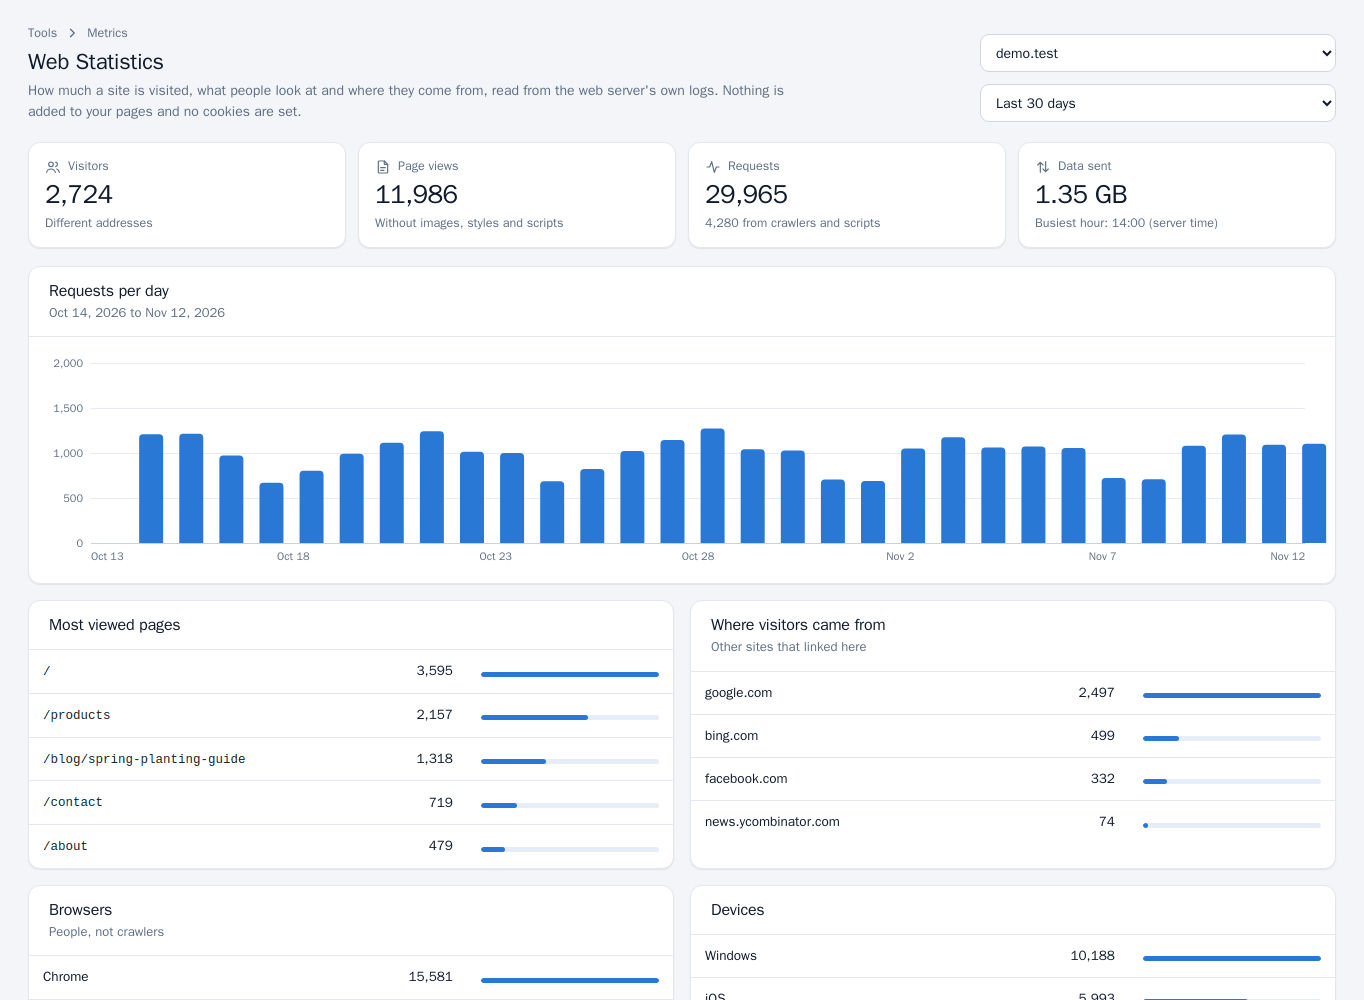
Notes and limits
- The web server keeps only one to two weeks of logs, so days older than that are not counted in Web Statistics.
- Very large logs are cut: the oldest days of the period may be left out, and the page says so.
- Resource Usage, Visitors, Errors, Bandwidth and Web Statistics can each be switched off per package in the Feature Manager.
- Per-account resource limits are set by the server administrator; see Account isolation.