Server Dashboard
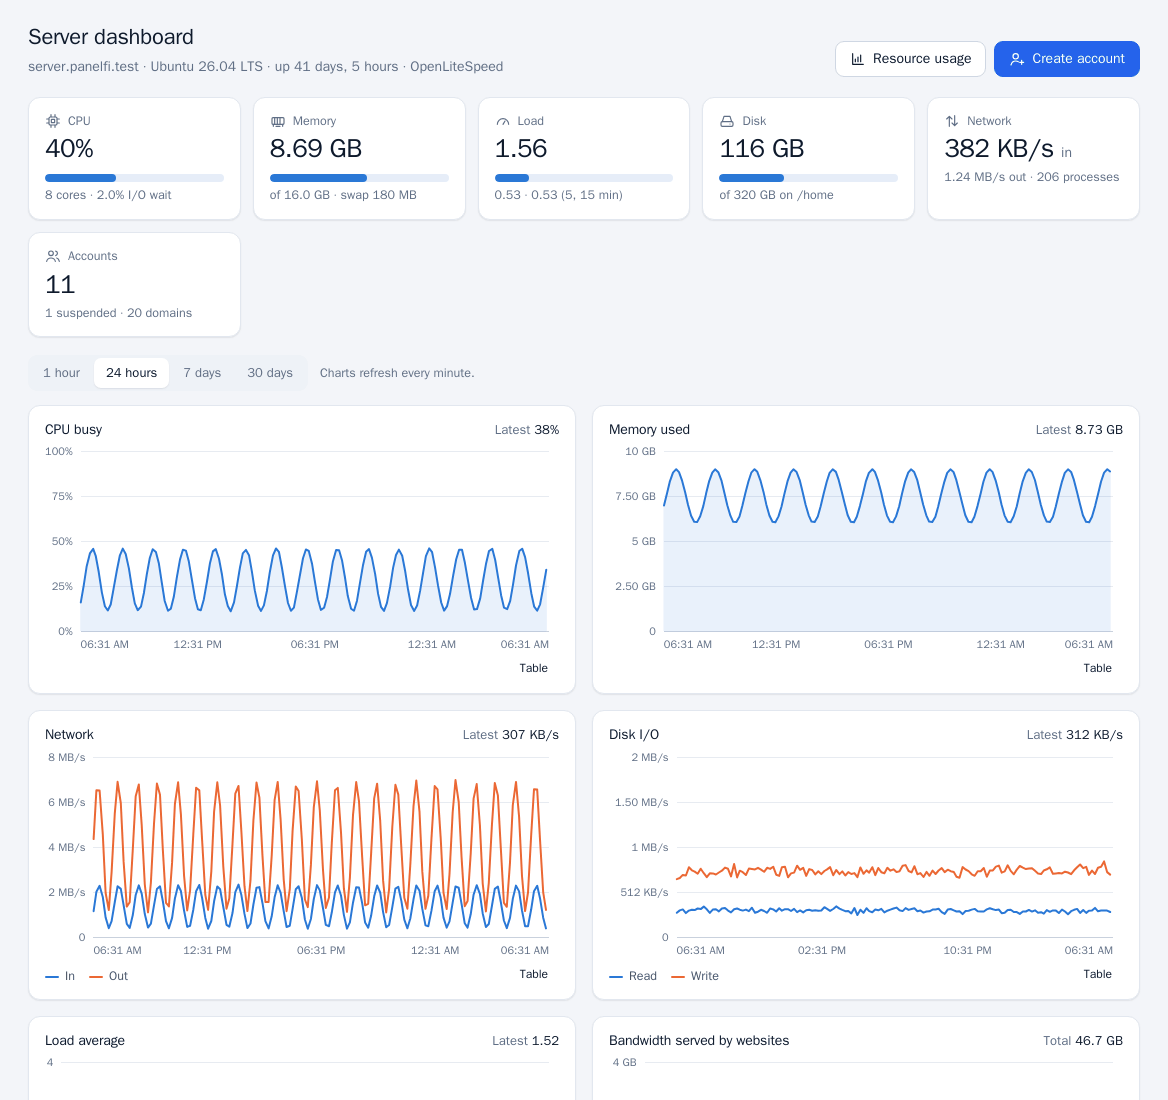
The home page of the server panel shows the hostname, OS, uptime and web server, plus tiles for CPU, Memory, Load (1, 5 and 15 minutes), Disk on /home, Network in and out with the process count, and Accounts (with suspended, domains and SSL failures). A warning appears if services are not running, linking to Service Status. Below are charts: CPU busy, Memory used, Network, Disk I/O, Load average and Bandwidth served by websites. Pick a time range above the charts.
Resource Usage
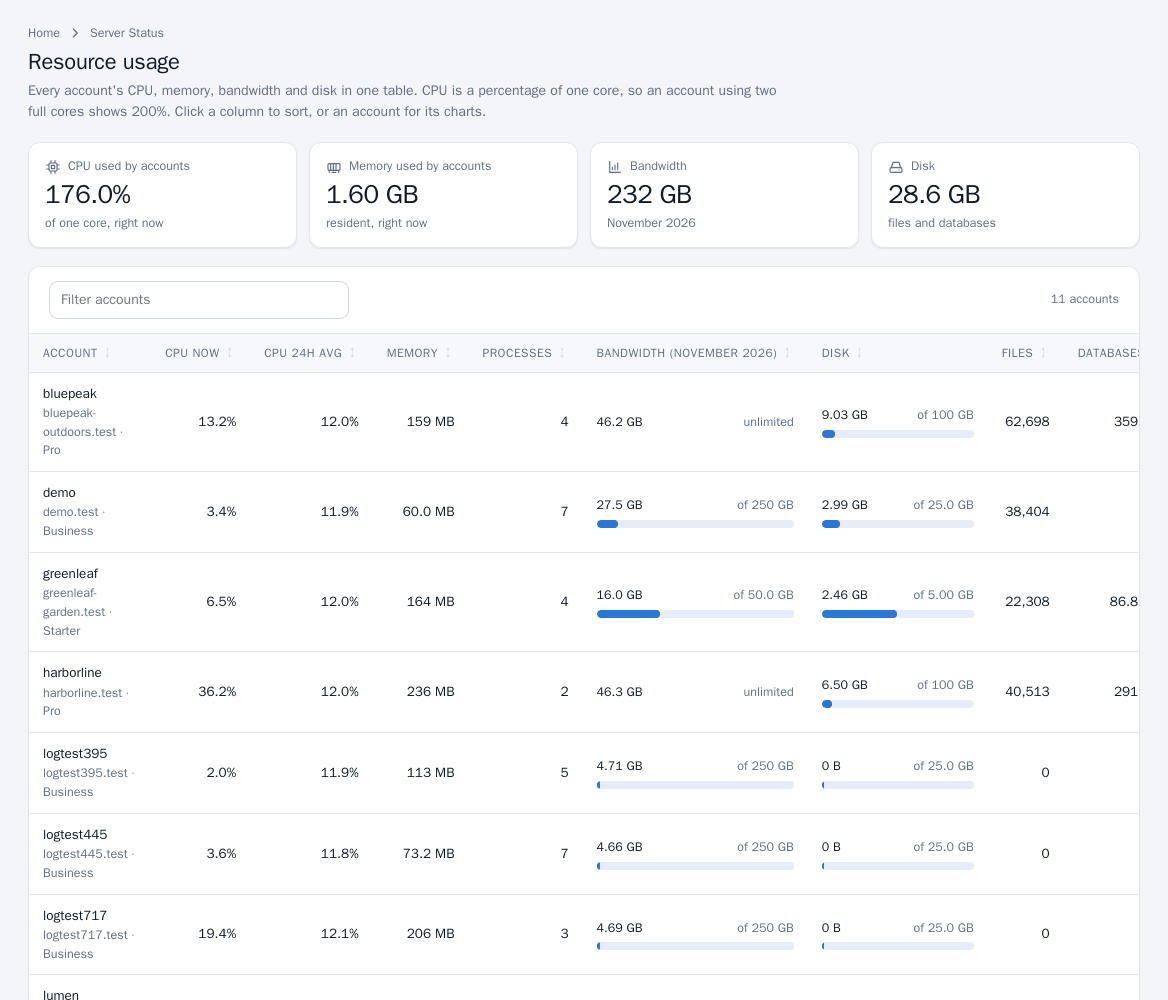
One table of every account's CPU now and 24-hour average, memory, processes, bandwidth for the month against its limit, disk (files and databases) against its limit, files (inodes) and databases. CPU is a percentage of one core, so two full cores show 200%. Click a column to sort, or an account for its charts. Resellers see their own accounts only.
Service Status and restarting services
- Open Server Status > Service Status (the same page serves Service Manager and Restart Services).
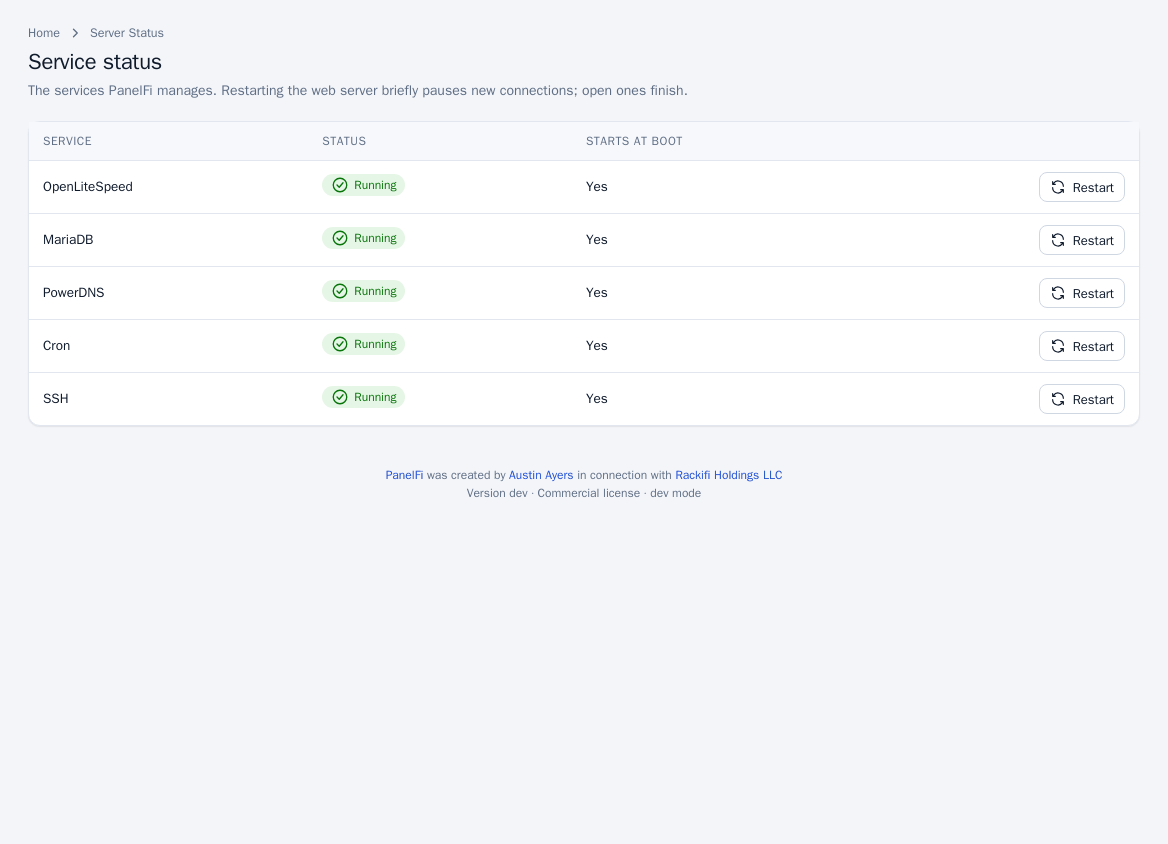
- Each managed service shows whether it is Running and whether it starts at boot.
- Click Restart (or Start for a stopped one). Restarting the web server briefly pauses new connections; open ones finish.
Task Queue Monitor
Opens the web server page at its background-job section, where a web server switch is tracked. See Web server.
Processes and disk usage
- System Health > Show Current Running Processes lists PID, user, CPU, memory, resident memory and command, sorted by CPU; Refresh reloads.
- System Health > Show Current Disk Usage opens the disks table in Server Information (mount, used, free, size, usage).
Graceful reboot
- Open System Reboot > Graceful Server Reboot.
- Type
rebootto confirm and click Reboot now.
Rebooting restarts the whole machine. Websites, email and the panel are offline until it comes back, usually within two minutes.
Get alerted
PanelFi can email you or post to a webhook when a service stops or a disk passes 90%; see Contact Manager.